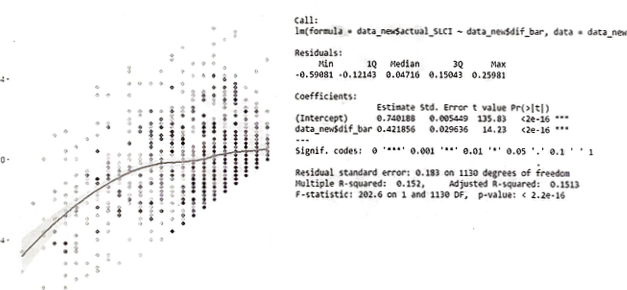
The primary objective of this statistical analysis was to determine the presence of a significant association between a cabinet size available to any given African leader and their possibility of forced exile. The dataset contained observations from 43 African countries and their leaders along with years of continuous leadership, available cabinet size for the given year, presence of civil war, polity score, presence of oil as over a third of GDP, presence of mineral as over a third of GDP, presence of ethnic fractionalization, lag GDP, and log of population. The dataset was analyzed primarily through exploratory data analysis and linear regression methods, which suggested that there indeed is a significant relationship between available cabinet size and the likelihood of forceful exile. For countries that do not depend on oil or mineral as a major portion of their GDP, data suggests that for every additional cabinet position available, the likelihood of a leader's exile decreases.
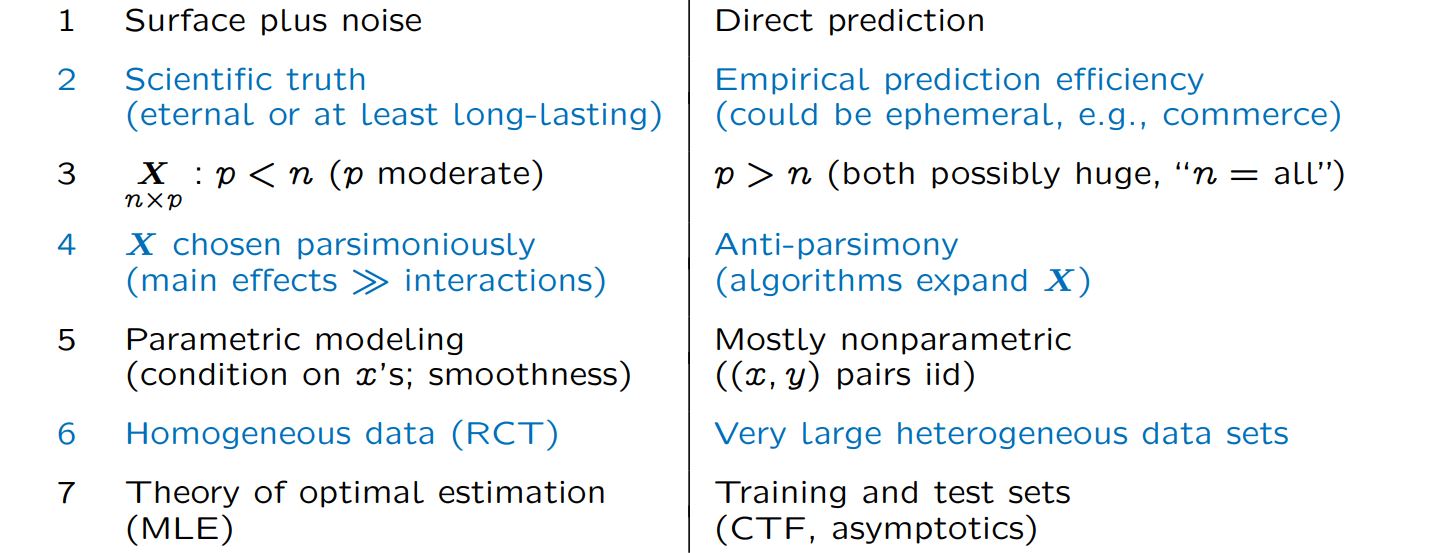
Going right into the topic, how exactly are the two different approaches different? They are both statistics, so how can they really be all that different?
Turns out, the difference can be quite drastic.
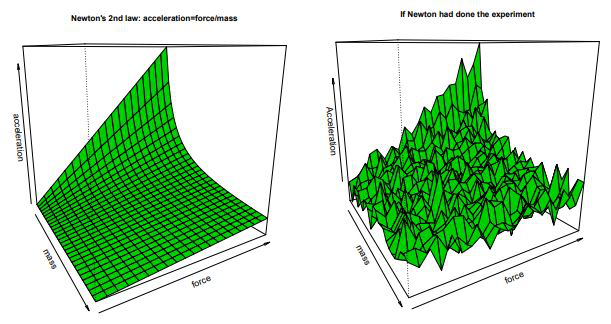
First thing to consider is the underlying objective of the modeling/algorithmic procedure. Estimation algorithms work with a critical assumption: There is a
(smooth) surface, the representation of the scientific truth, that is blanketed by chaotic noise of the world. All the effort is focused around getting to the
core of this surface, ultimately uncovering the scientific truth; a rule in which this universe is run. In comparison, prediction algorithms, true to its name,
only focuses on exactly that -prediction. The thought is to throw every little thing that we know that connects to the value that we want to find (and sometimes
this connection is a stretch) in order to find get the closest prediction possible. In order to acheive this, data scientists and machine learning engineers are
very comfortable with using ephemeral data that inevitably requires an update. Often, it is in my experience that the model that is created is only relevant
until the next batch of data. Most of the major differences in the algorithms stem from these differing perspectives and approaches.

Bevacizumab, otherwise known as Avastin, is a medication used to treat a variety of types of cancers. In the study conducted by the client (Prof. Mark Conaway), an experiment using 4 doses of bevacizumab {0, 0.05, 0.10, and 0.25 mm} and 4 doses of PD901 {0, 0.005, 0.01, and 0.025 mm} were run with 3 biological replicates. The main objective of this statistical study is to determine whether bevacizumab and PD901 act additively in inhibiting cell growth.
Analysis of the client's dataset uncovered noteworthy results. Statistical modeling supports that bevacizumab and PD901 do act additively in inhibiting cell growth. However, the additive effects are not constant. The synergy of the two drugs grows strong or weaker based on the different combinations of dosage.